Structural MRI Scans: Applications and Analysis Methods
I. Introduction
Structural MRI scans provide detailed anatomical images of the brain, allowing researchers and clinicians to assess brain structure and identify abnormalities. This lecture note explores the different types of studies utilizing structural MRI scans, quantitative analysis methods, and limitations to consider when interpreting the results.
II. Qualitative Evaluation of Brain Abnormalities
This initial evaluation involves examining the scan for visual signs of potential abnormalities. Some common examples include:
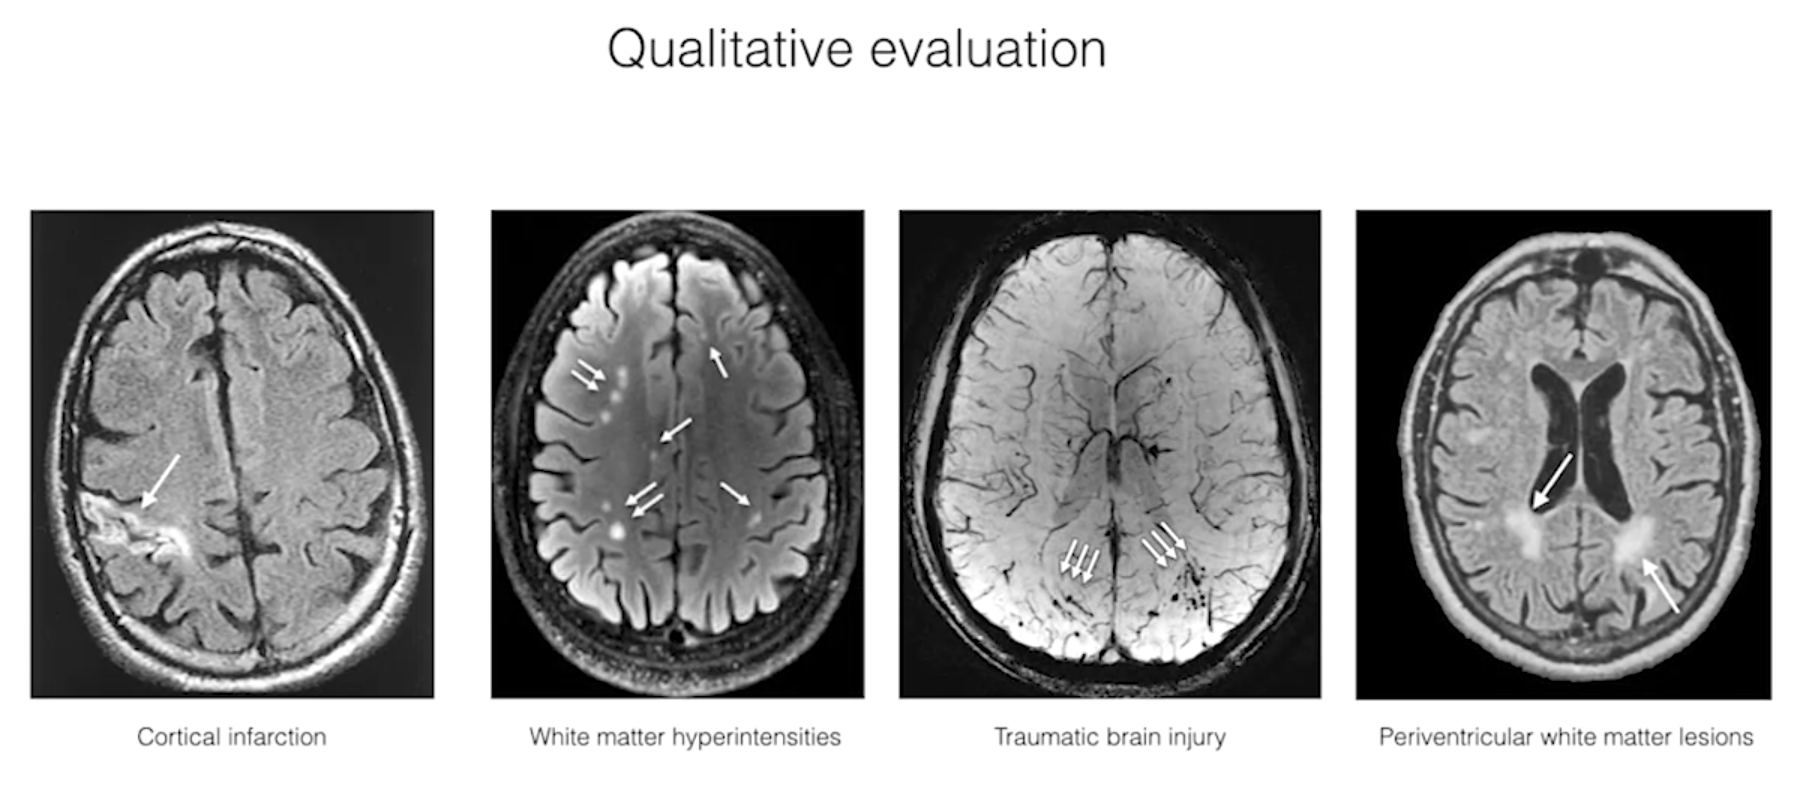
- A. Identifying cortical infarctions: These appear as dark regions on the scan, indicating damaged brain tissue due to stroke.
- B. Detecting white matter hyperintensities: These appear as brighter areas and can be associated with various conditions like small vessel disease or aging.
- C. Visualizing traumatic brain injuries: Depending on the severity, injuries may appear as focal lesions or shearing (tearing) in white and gray matter.
- D. Observing periventricular white matter lesions: These appear as bright spots near the ventricles (fluid-filled cavities) and are common in aging individuals.
- E. Diagnosing diseases like Wilson’s disease: This disease can cause hyperintensities in both gray and white matter areas.
III. Quantitative Structural Analysis Methods These methods allow for more objective and precise measurements of brain structures:
A. Volumetric Analysis
This technique measures the volume of specific brain regions. There are two main approaches:
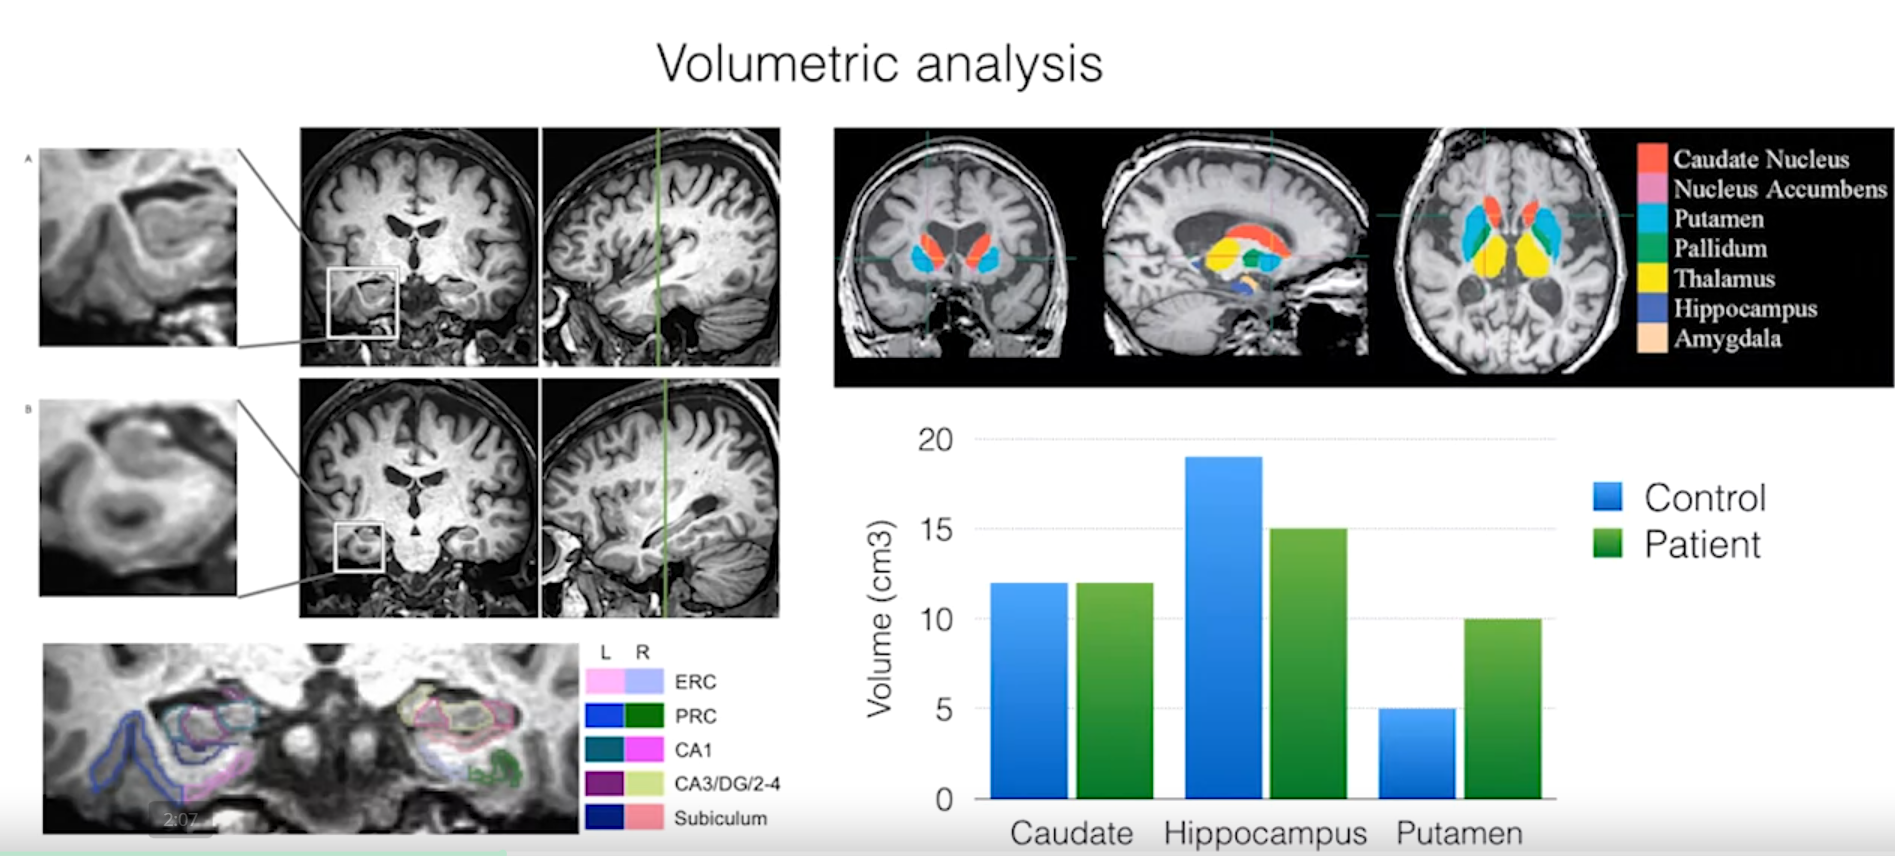
- 1. Manual segmentation:
- a) Outlining regions of interest: Researchers manually trace the boundaries of the structure on the scan.
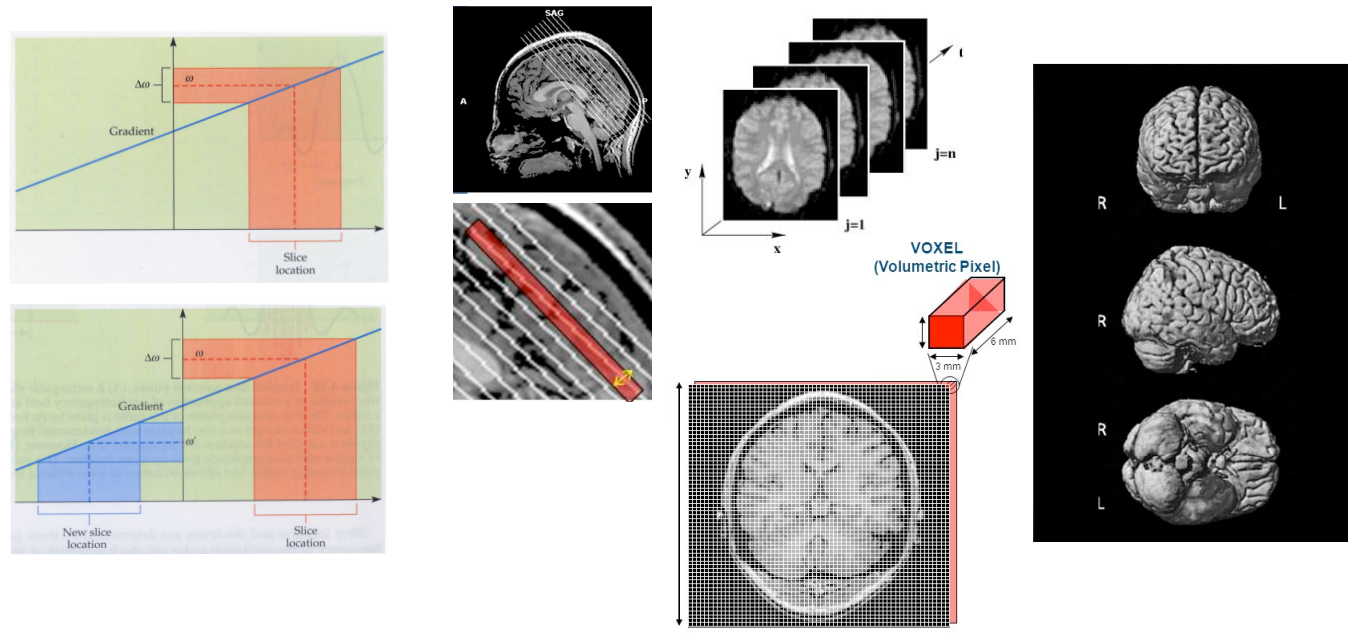
- b) Calculating volume based on voxel count: Each MRI scan consists of 3D voxels (volumetric pixels). By counting the number of voxels within the outlined region and multiplying by the voxel size, the volume can be calculated.
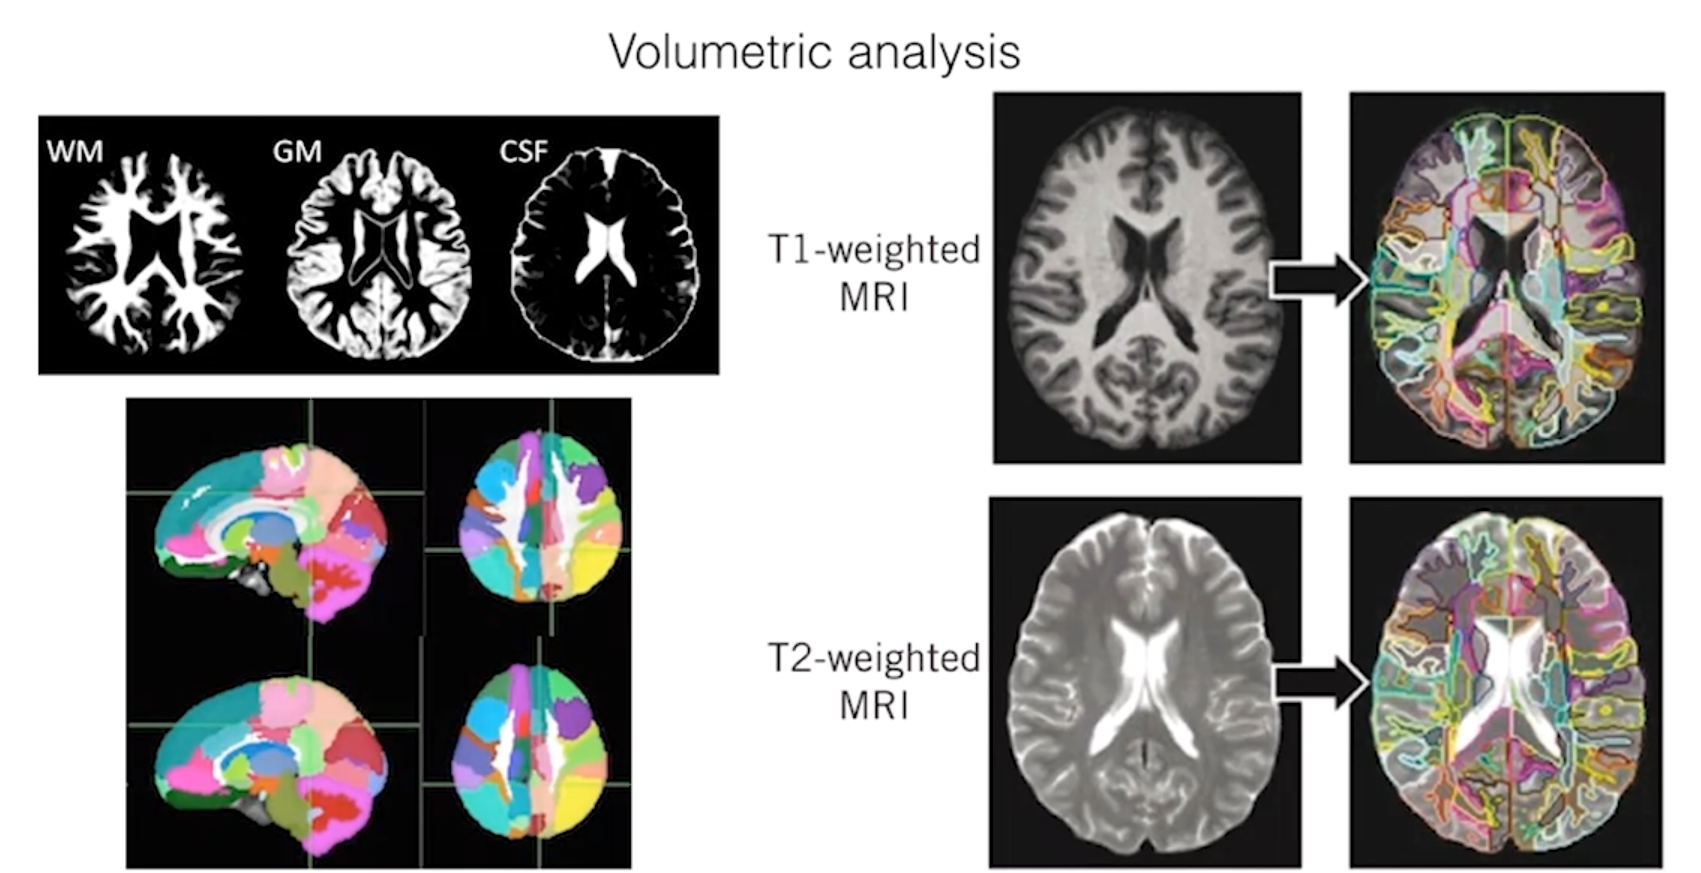
- 2. Automated segmentation
- a) Separating tissue classes: Software automatically segments the brain into different tissue types like gray matter, white matter, and cerebrospinal fluid (CSF).
- b) Labeling structures to measure volumes: Based on anatomical information, specific structures within the segmented tissue classes can be labeled and their volumes measured.
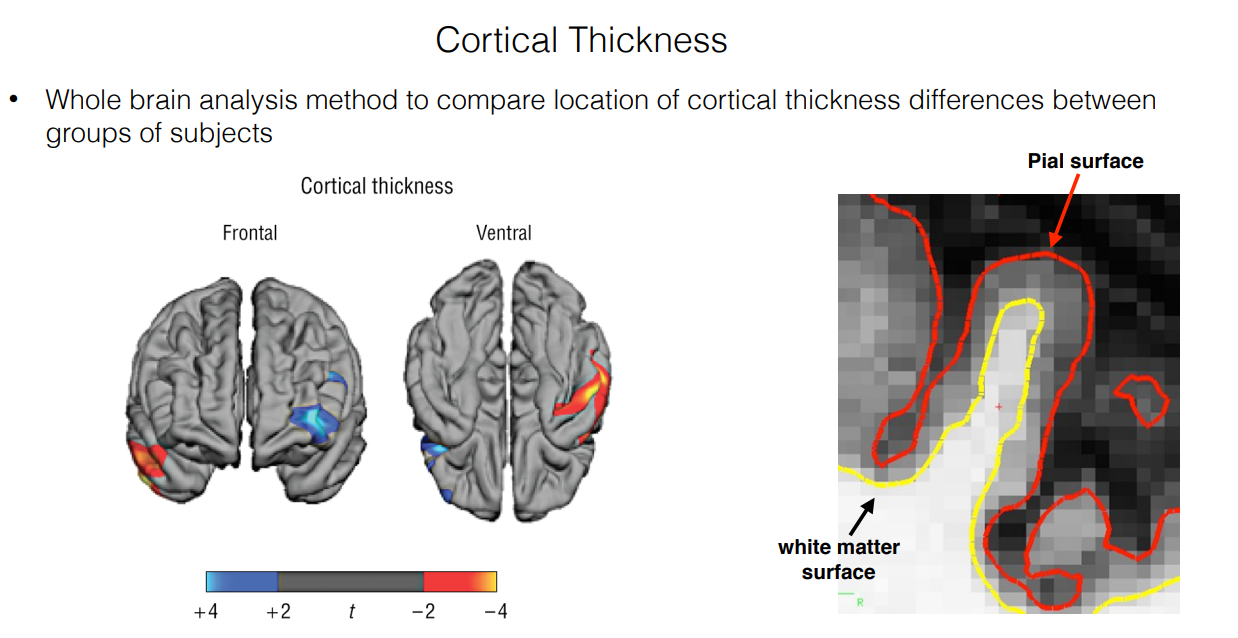
B. Cortical Thickness Measurement
This method focuses on the thickness of the gray matter cortex, which is involved in higher-order functions. It involves:
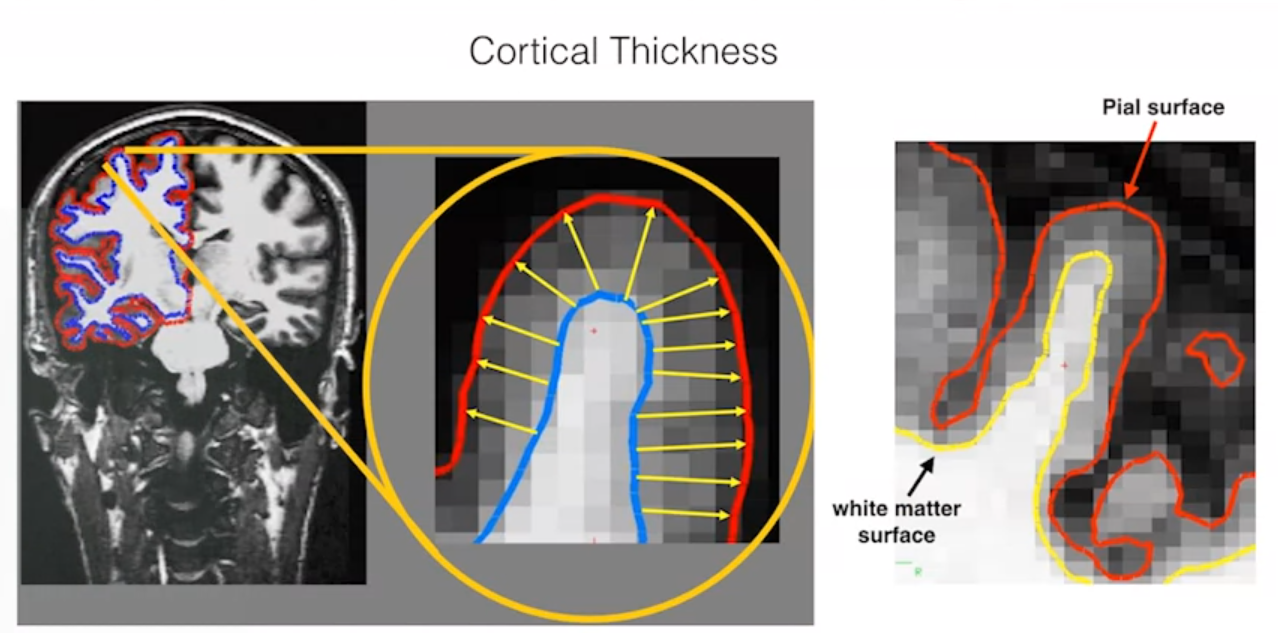
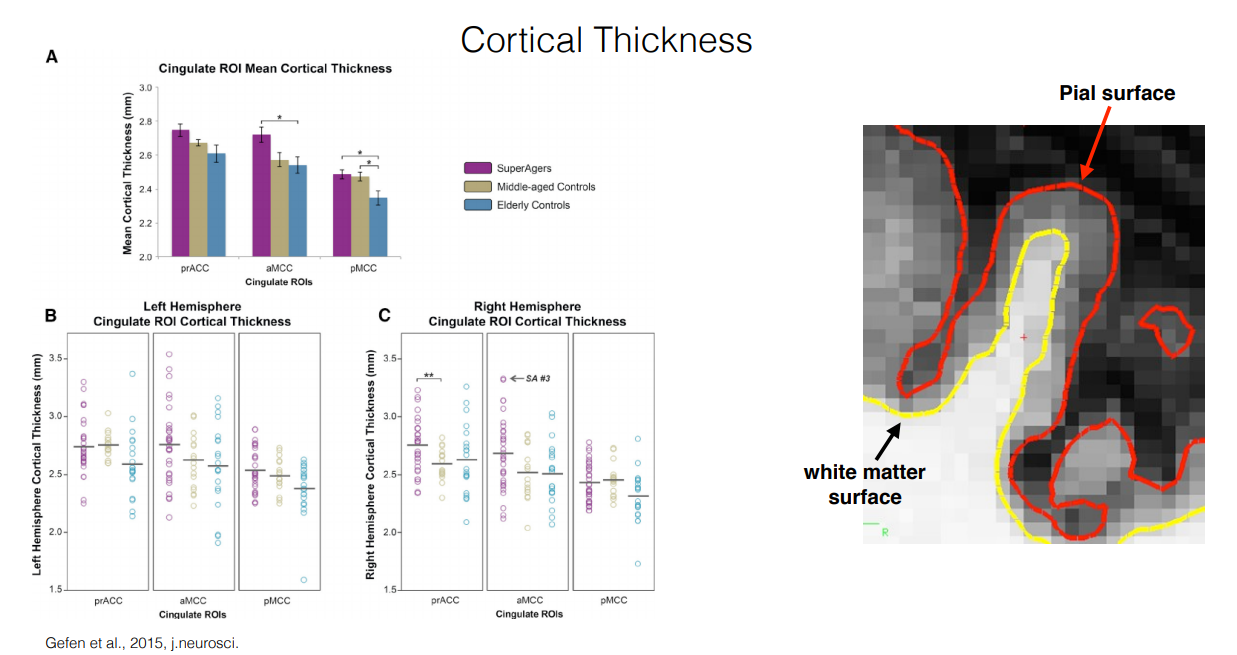
- 1. Finding gray/white matter boundaries: Software algorithms identify the interface between the gray matter (darker) and white matter (brighter) on the scan.
- 2. Quantifying cortical thickness across regions: The distance between the boundaries is measured at various points across the cortex to provide an average thickness for specific regions.
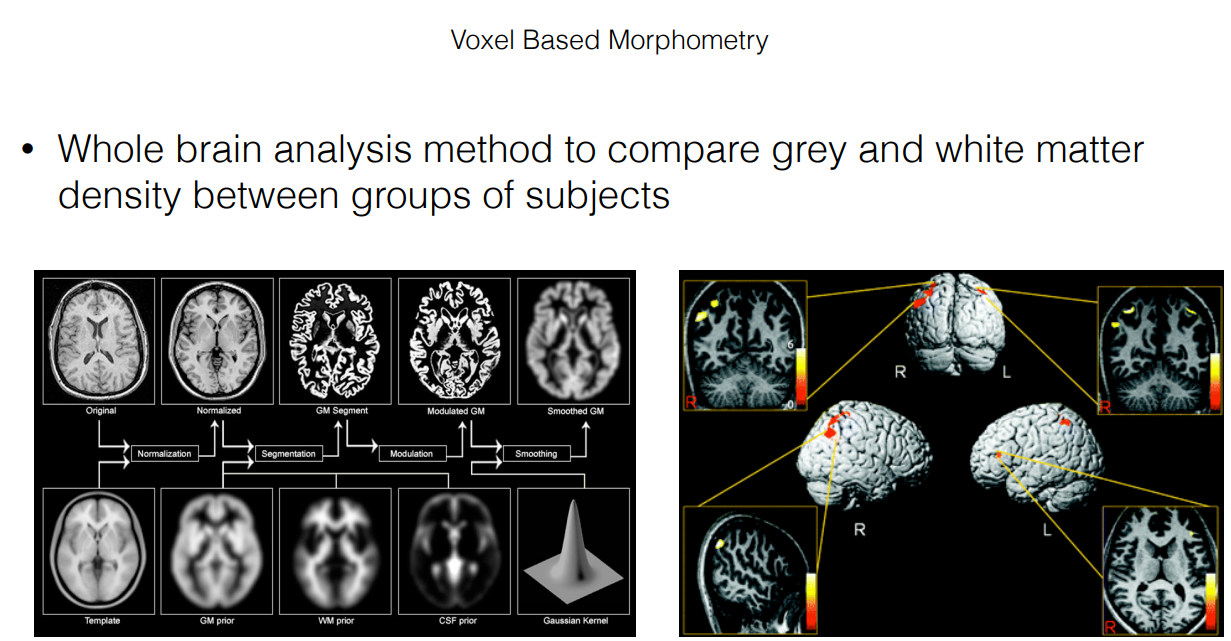
C. Voxel-Based Morphometry (VBM)
This is a whole-brain analysis approach that searches for statistically significant differences in gray or white matter density throughout the brain. Unlike volumetric analysis, VBM doesn’t require pre-defined regions of interest.
IV. Longitudinal Structural Studies
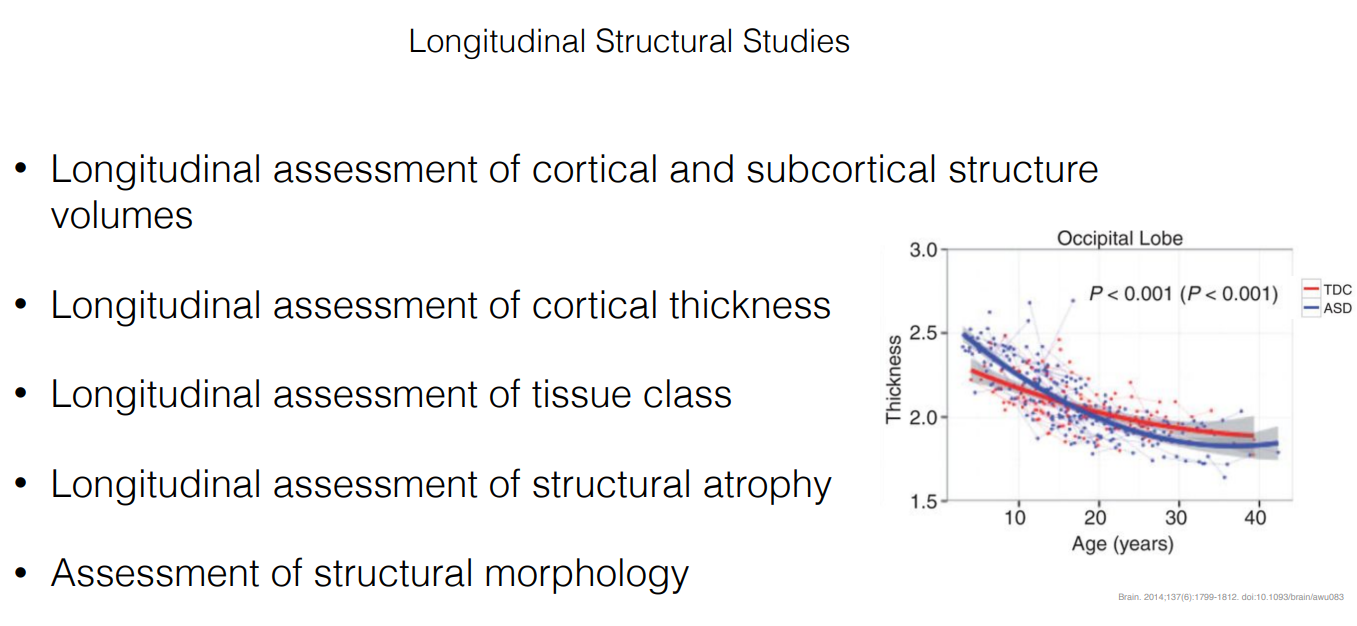 *Figure: Thickness of Occipital Lobe of children with autism vs non autism *
These studies involve repeated MRI scans over time to track changes in brain structure. They can be used to:
- A. Track volume changes over time: This can be helpful in investigating disease progression, such as monitoring atrophy (shrinkage) in Alzheimer’s disease. Specific structures like the hippocampus, crucial for memory, can be monitored.
- B. Assessing cortical thickness changes: Similar to volume, cortical thickness can be tracked over time to understand how it changes with development, aging, or disease progression.
- C. Measuring structural atrophy: Longitudinal studies can quantify the rate of brain tissue loss in neurodegenerative diseases.
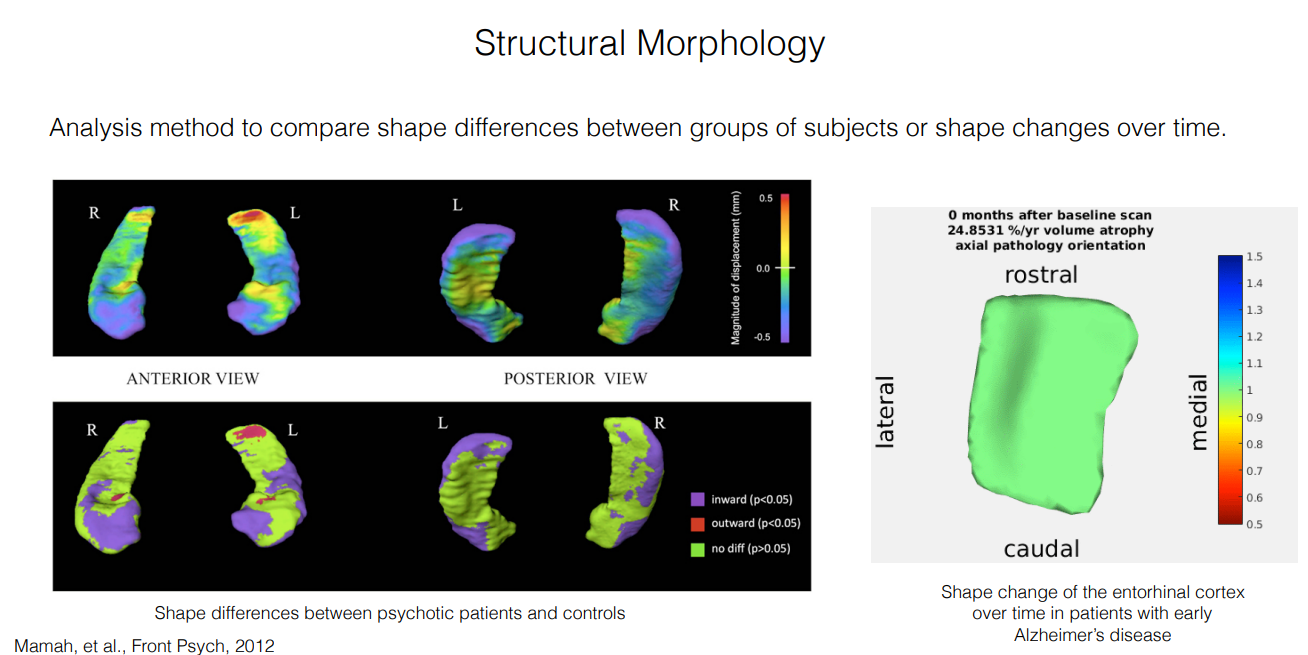
- D. Analyzing structural morphology (shape) changes: While volume might remain constant, subtle shape changes in brain structures can occur over time. VBM or specific software can be used to detect these changes.
V. Correlating Brain Structure with Behavior/Function
Understanding the relationship between brain structure and behavior/function is a key area of research. Structural MRI findings can be correlated with:
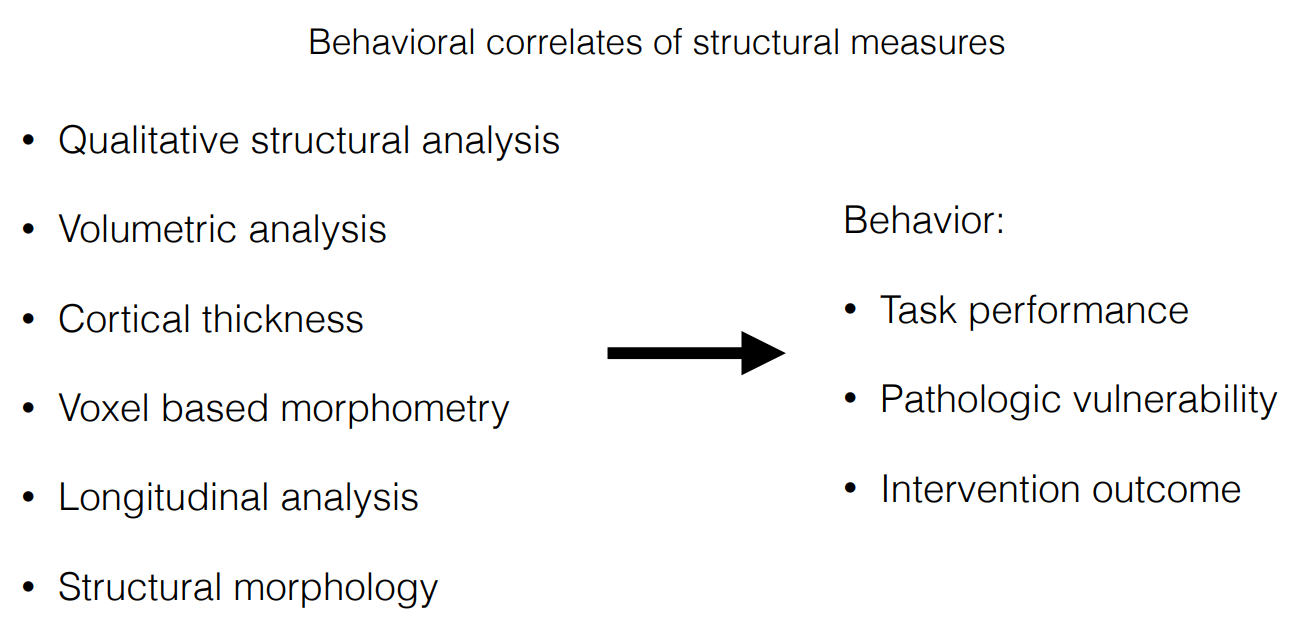
- A. Relating to task performance: Researchers can compare brain structure in individuals performing specific tasks to understand the neural correlates of behavior.
- B. Predicting pathological vulnerability: Brain structure abnormalities might indicate an increased risk for developing certain diseases.
- C. Evaluating intervention outcomes: Structural MRI can be used to assess changes in brain structure following interventions like exercise programs or medication.
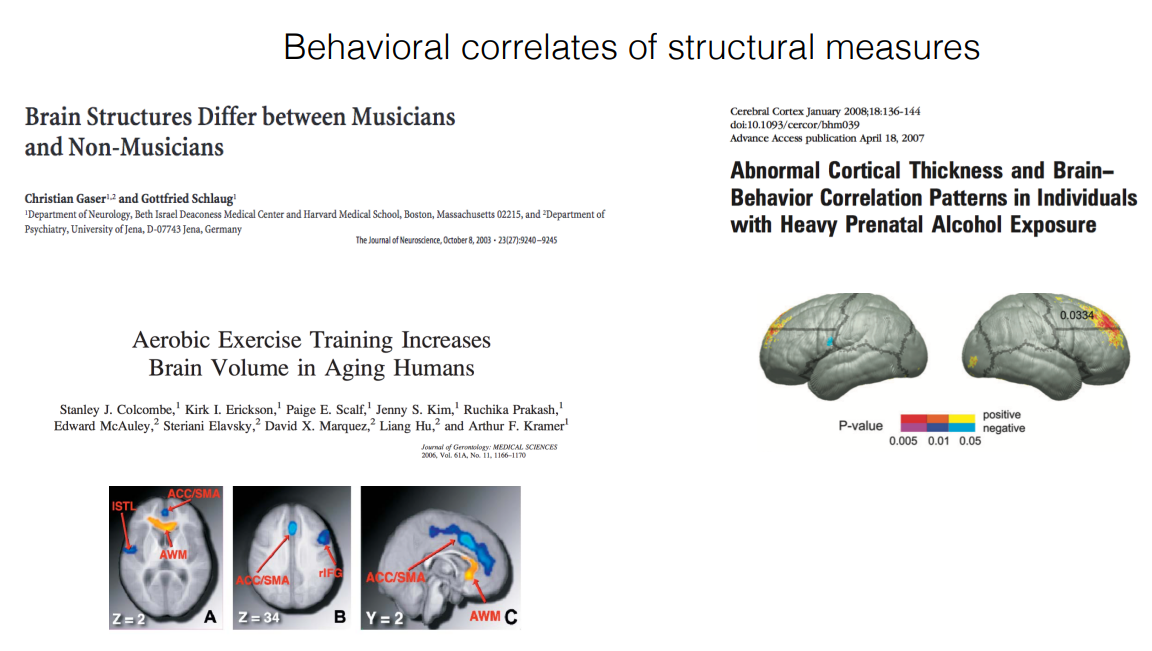
Examples:
- Studies have shown brain structure differences between musicians and non-musicians, suggesting potential brain plasticity related to musical training.
- Aerobic exercise training has been shown to increase brain volume in older adults.
- Abnormal cortical thickness is observed in individuals with heavy prenatal alcohol exposure, potentially impacting their cognitive function.
VI. Limitations and Confounding Factors
-
A. Causes of structural brain changes:
- Relevant factors:
- Neurodevelopment and neurodegeneration: These are the primary areas of interest in many studies. Brain structures naturally change in size and shape throughout development and can shrink in neurodegenerative diseases like Alzheimer’s and Parkinson’s.
- Confounding factors:
- Exercise: Regular exercise can lead to increased brain volume in some regions, which can be misinterpreted if not accounted for in the study design.
- Substance use: Chronic use of alcohol or drugs can significantly impact brain volume, leading to shrinkage or other abnormalities.
- Inflammation: Inflammation throughout the body or within the brain itself can cause temporary or long-term swelling, affecting volume measurements.
- Gliosis: When glial cells (supportive cells in the brain) are activated due to injury or disease, they can increase in number and volume. This doesn’t necessarily reflect changes in neurons and could be misinterpreted as a structural change.
- Relevant factors:
-
B. Careful interpretation required: Researchers need to carefully consider these potential confounding factors when designing and interpreting studies utilizing structural MRI.